Building A Marketing Tech Stack for Ad-Monetized Games

Hi, I’m Paula Neves, and I’m the CEO of Gazeus Games. We’re a mobile games developer from Rio de Janeiro, Brazil with over 70 people in our HQ.

We have more than 40 titles for Android, iOS and Facebook Instant Games and 9 million monthly active users, playing from all over the world. Our main titles are classical card and board games, the ones that you grow up playing with your family, like Dominoes, Mahjong, Spades, Euchre, etc.


The company started in 2006 with the games portal jogatina.com, that caters only to the Brazilian market. In 2012 we ported our first game to mobile and have been mobile first ever since, having expanded in the meantime to many other geographies. Some of our top geos are the USA, Canada, Italy, Mexico, Brazil and Great Britain.
Ninety-nine percent of our mobile revenues come from ads, and we’re not talking rewarded videos, but interstitials and banners. Due to that, when I first started at the company, we didn’t have campaign-level ROI and couldn’t calculate LTVs. That was a big problem, since LTVs coming from ads are typically lower than that of IAP-based games, user acquisition has to be spot on and very much data driven. I knew the ROI for a given app, that is, I knew how much money I’d invested in it versus how much revenue it had generated, but didn’t have that by a campaign basis, to know which ones were bringing in higher LTV users and had better ROI.
Therefore we had to start building our tech stack and we did it from scratch, because we were having a hard time trying to find reliable 3rd party providers. In some cases, the 3rd party providers wouldn’t support some of the smaller networks we used, in other cases, they didn’t do an iPad/iPhone breakdown or worse: we were seeing discrepancies in the data. Some services claim they can send the value of each impression (1st impression was $x, 2nd impression was $y, etc), but since most ad networks don’t send out user level cost data or impression level data, in the end of the day these providers will have an average, at best.
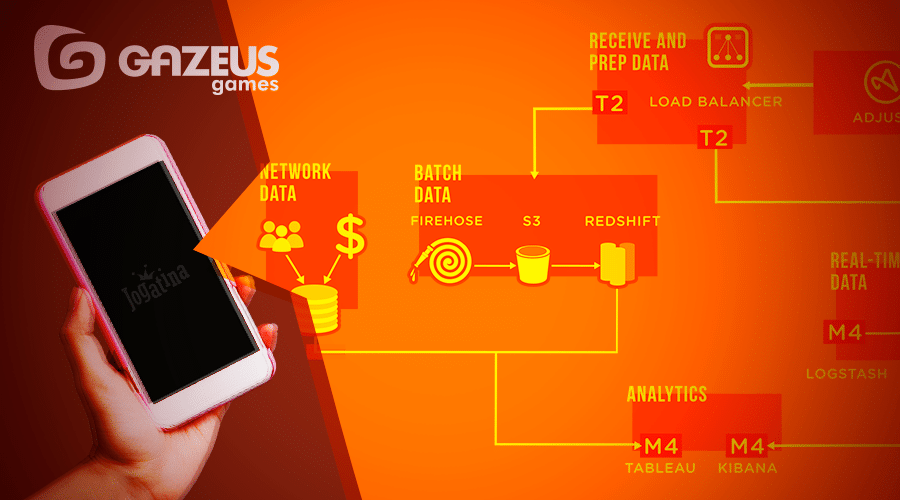
Our first hurdle was not knowing the revenues in real-time. Since we’re talking about ads here, one can only know the true eCPM for a given day on the next day, that is, today I’ll know yesterday’s eCPM but not today’s. So we had to first build a structure to collect this information and be able to do the math the next day. So this is part of what we had to do:
On one end, the client would send events for every interstitial and standard banner impression we had and we would collect that user level data through our MMP’s callbacks. These user level events go out to our S3 bucket. On the other end, we would connect to the networks apis and retrieve both cost and revenue data that way. We combine the user-level data we collect with the data from the apis, using Redshift and build views for the different teams in Tableau. One might think that collecting the data from apis might be a simpler feat, but it isn’t. Even here we had to come up with creative solutions because each api will work in a different way, or a given network might not send campaign ID and another might not send country information. So we had to devise a series of tags that we append to the campaign name and our structure will then understand the country, ID and so on and map them out accordingly.
Once we had all of that ready, we could collect yesterday’s eCPM by network, banner format and geo and we knew how many impressions that network had generated on that day, because of our user-level impression events. With that, we calculate the revenue per impression and multiply that by the number of impressions a given user makes. That’ll give us the user’s revenue. It’s the closest approximation we could come up with considering that ad networks don’t send out user-level cost data and impression level eCPMs.
With this structure we were able to build several LTV views on Tableau, ROI by cohort age views and know the LTVs and ROIs for the users coming from a given campaign, in a given country and a specific device. This completely shifted our UA strategy towards more ROI positive games. Previously, we focused a lot on CPI and on the ARPDAU of the game, we even devised a CPI:ARPDAU ratio, but these wouldn’t necessarily have the best ROI. With this whole structure in place we were able to take more assertive decisions towards campaigns that would break even quicker and were providing better ROAS.


